Data stories
Turn your spreadsheet into a story people can explore.
Build an interactive dashboard, refine the views, and share one link.
Free to start. No card required.
From a spreadsheet to one link
No formulas to write and nothing to install.
- Add your dataDrop a CSV, TSV or Excel file, or paste a table. You see its first rows before anything is uploaded; every row is read when you build.
- Refine the viewsDrag fields onto Columns and Rows, pick a suggested view, or ask the AI in plain words. Every number is computed from your data.
- Share one linkSharing stays off until you turn it on. Readers filter and compare; the link carries totals, never your rows.
Two more to explore
Made-up data, real dashboards. Open one, or try it with its data.
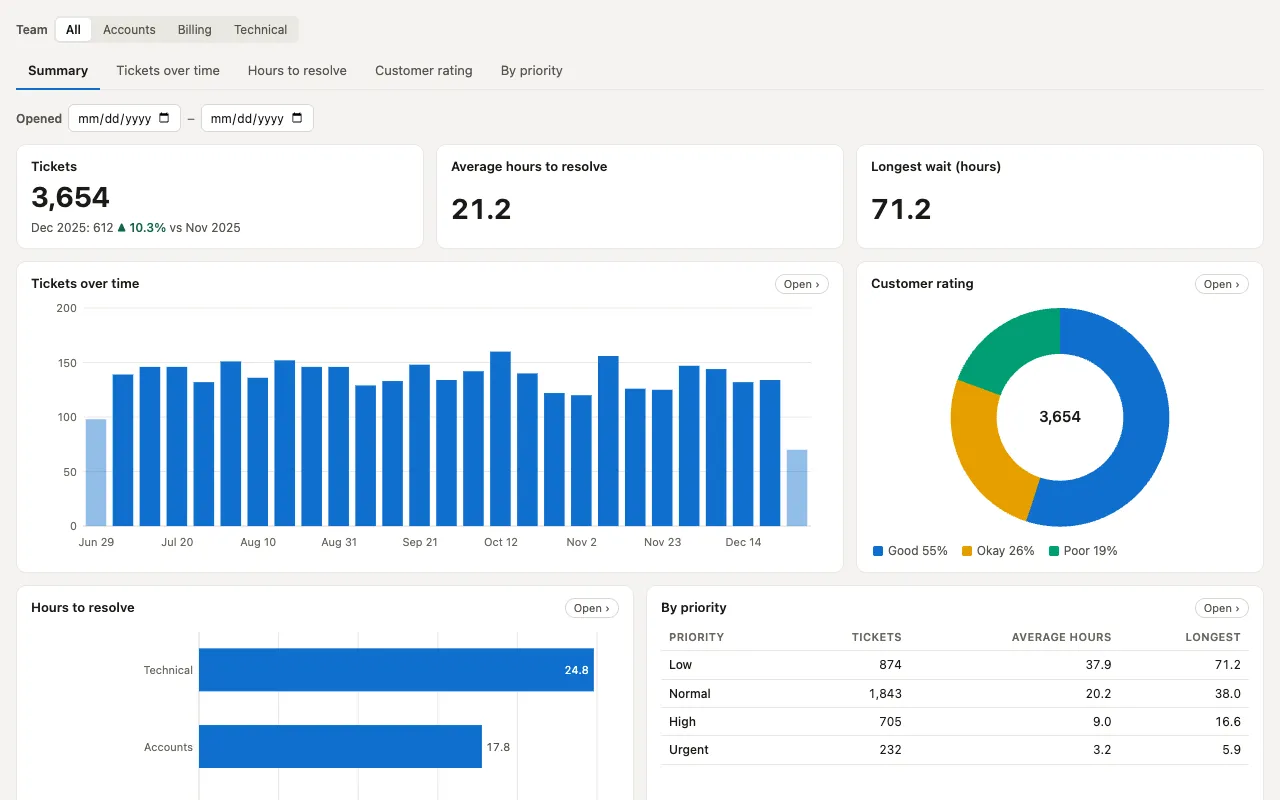
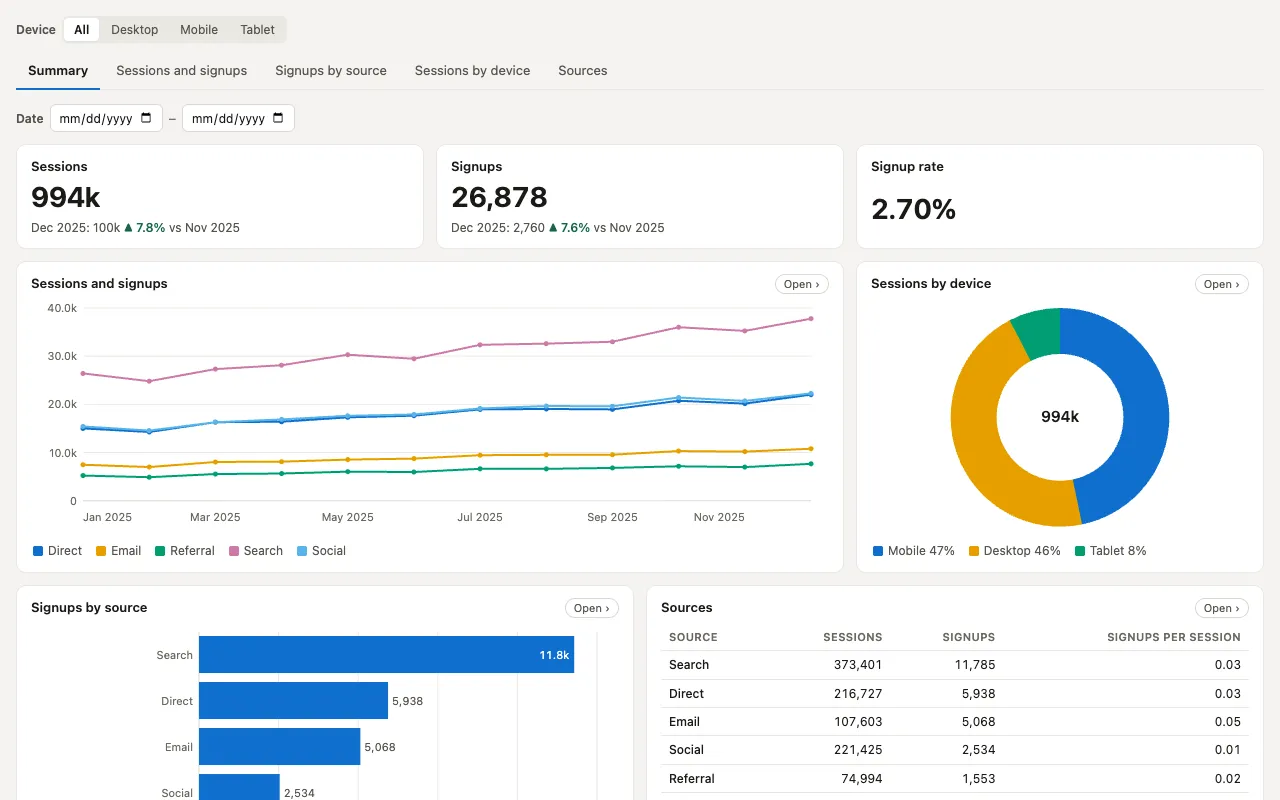
Short answers
What can I bring?
A CSV or TSV file, an Excel workbook (.xlsx), or a table pasted from a spreadsheet. Old .xls files can’t be read — save them as .xlsx or CSV first. The size limits show when you choose a file.
Can I change what it shows?
Yes. A dashboard starts as one empty view: drag fields onto it, pick a suggested view, let “Build it for me” choose from your columns, or ask the AI. Every view stays editable after you share it, at the same link.
What does a shared link show?
The charts and the totals behind them — summaries of your data, never its rows. Sharing is off until you turn it on. When groups are very small a summary comes close to individual values, and the editor tells you before you share.
Does the AI see my data?
Only when you ask it to build or change a view. Then it reads your column names and a few sample rows and decides what to show; DeckSpace computes every number. Asking uses your AI allowance.